
Google Adwords require patience, persistence, and perspiration. Its hard work and it needs to be part of a long-term marketing strategy. Reacting too quickly results in judgment errors and a continual thrashing of your decisions.
A great example of this is an advertising split test. I have seen rookies that set up a test and declare a victor with 100 clicks and start making decisions based on the facts they just absolutely proved with a “one click” difference. With full belief in their results they tell a client that one ad was twice as effective as the other and, of course, they predicted that outcome just two days ago. They got one conversion with one ad and two with the other.
An immutable rule of marketing states that “You cannot predict the action of an individual but you can predict the action of a group”. What does this rule actually say to us? It says that your data sample has to be big enough for it to represent a group not an individual decision. You need patience because you need a sample large enough to get to your number with some degree of confidence.
The next logical question is “How do we figure out how many need to be in the sample?” Good question although we are not ready to answer that quite yet. First we have to get some idea of the margin of error. The simplest way to do this is to set up a split test in several Adwords groups. You need to make everything absolutely the same.
- Same keywords
- Same traffic split (set campaign to serve evenly and turn off the content network)
- Same ad copy
- Same landing page
- Same conversion objective
- Same Start & End Date/Time
Logic would tell us that the results of this should be the exactly the same but they almost never are. The longer you run this the more the numbers move toward each other and at some point in this time line the differences settle in. Track this data weekly so you can see the patterns until your numbers slow down in their movement. I recommend doing this over several ad groups to get an understanding of how these factors interact. There are actually more accurate ways to measure this but that typically requires engaging professional market researchers.
With a sample size and margin of error you can now set up split tests where you change the ad copy, while keeping all the rest of the path the same. When you reach your sample size on all the ads examine your actual results with the margin of error. The graph below assumes our test had a 1% margin of error.
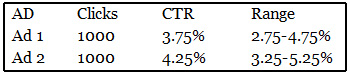
These results are “Too Close To Call”. The two data sets overlap from 3.25 to 4.75 so within that range either of these could be the winner. While we are talking about this lets consider that the margin of error also has a margin of error. This math might be scary to some and I do not do this math all the time because I have a life and I like to live it. I have a simple rule of thumb and that is if the winner is winning by more than the margin of error then I tend to believe the result, otherwise I keep testing.
On sample size, my rule of thumb is that I do not believe a result until it has at least 1,000 events. If I am testing ad groups then I want to see an average of 1,000 clicks on each ad before I start making decisions. In some accounts this can take several weeks or even a few months but if you truly want to make a good decision you have to wait for the experiment to finish. On top of this consider that the market is a complex place and your results can be tainted by external events. Events like holidays, items in the news, and a thousand other things can change your results.
In closing continually question and test your marketing and strive to become one with the campaign.